Why ART?
ART originated amidst growing challenges in recruiting sufficient staff and managing workload fluctuations across Icon Group.
As we expanded into regional centres offering advanced medical techniques and technologies, the need for a robust support system became evident. These specialised services required meticulous planning and delivery, intensifying pressure on our sites. To gauge this, we undertook site-specific evaluations, revealing that staff shortages often led to treatment delays, as well as staff overwhelm and burnout. Our workload management and resource solution for radiation therapists, effectively redistributes resources, ensuring continuity in patient care even during staff absences.
This initiative has led to a more flexible, responsive staffing model, reducing the strain on individual sites, and enhancing overall service delivery. By maintaining treatment schedules consistently, we’ve improved patient outcomes, time to treatment, and staff morale, including more time for professional development.
Implentation process
The implementation of the Global ART Workforce Tool followed a meticulous, multi-staged process:
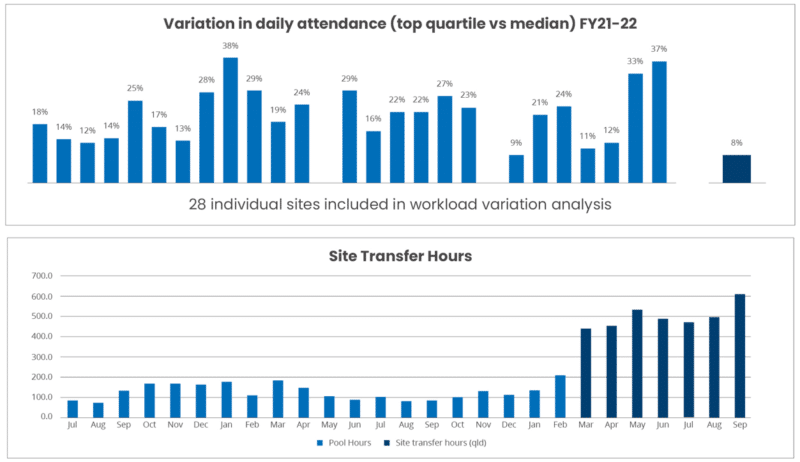
- Workload analysis: conducted by an analyst and clinical leaders to understand existing pressures.
- Forecasting: projected staffing needs over five years, establishing a baseline for improvements.
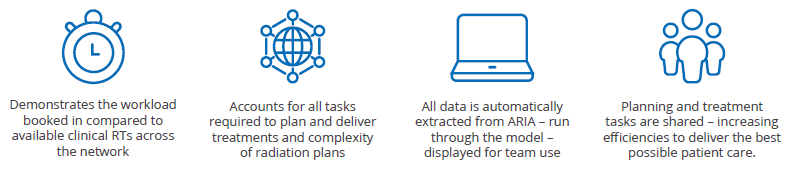
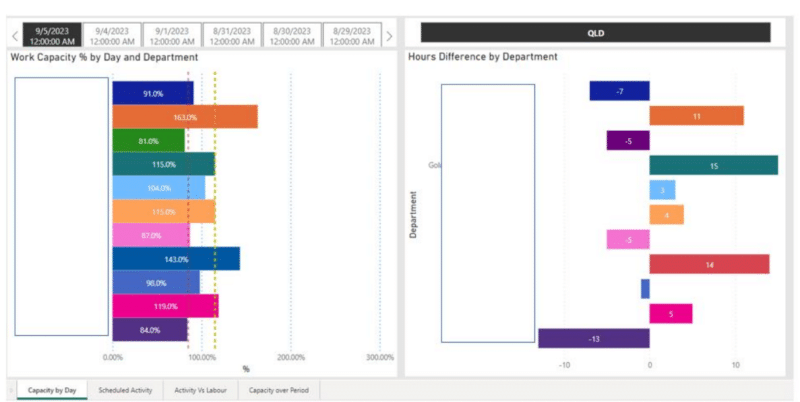
- Stakeholder engagement: we involved staff at all sites in developing a workload management model and a real-time dashboard using Power BI for transparent resource allocation.
- Phased onboarding: piloted and initiated state by state in Australia, allowing real-time adjustments and feedback to refine processes.
- Guideline development: standardised scheduling and rostering practices to ensure consistency across all sites, and subsequent implementation across our entire Australian network.
- Management oversight: We have appointed a manager to oversee workload distribution which has been initially piloted in Queensland, Australia, with plans for broader implementation.
Learnings and outcomes
The impact of this tool has been significant, beginning in Australia and now expanding across various regions, including into Asia, and disciplines beyond radiotherapy. This initiative has led to a more flexible, responsive staffing model, reducing the strain on individual sites, and enhancing overall service delivery. By maintaining treatment schedules consistently, we’ve improved patient outcomes, time to treatment, and staff morale, including more time for professional development.
Learnings:
- Data and consistent communication are key and guides decision making
- Flow on effects of visibility of data need to be considered
Outcomes:
- Improved transparency and workload sharing across network
- Sclable tool that can be used for multiple craft groups and large georgraphical footprint
- Ability to manage workload better and still allow for non-clinical work – i.e. professional development
- Reduced staff burnout and increased engagement